Solutions → Aviation → Analytics Dashboard

NERVA

Airside intelligence. Every inspection, in one place.

Living software, not a screenshot

Every scan becomes a pattern.

FOD detected
121
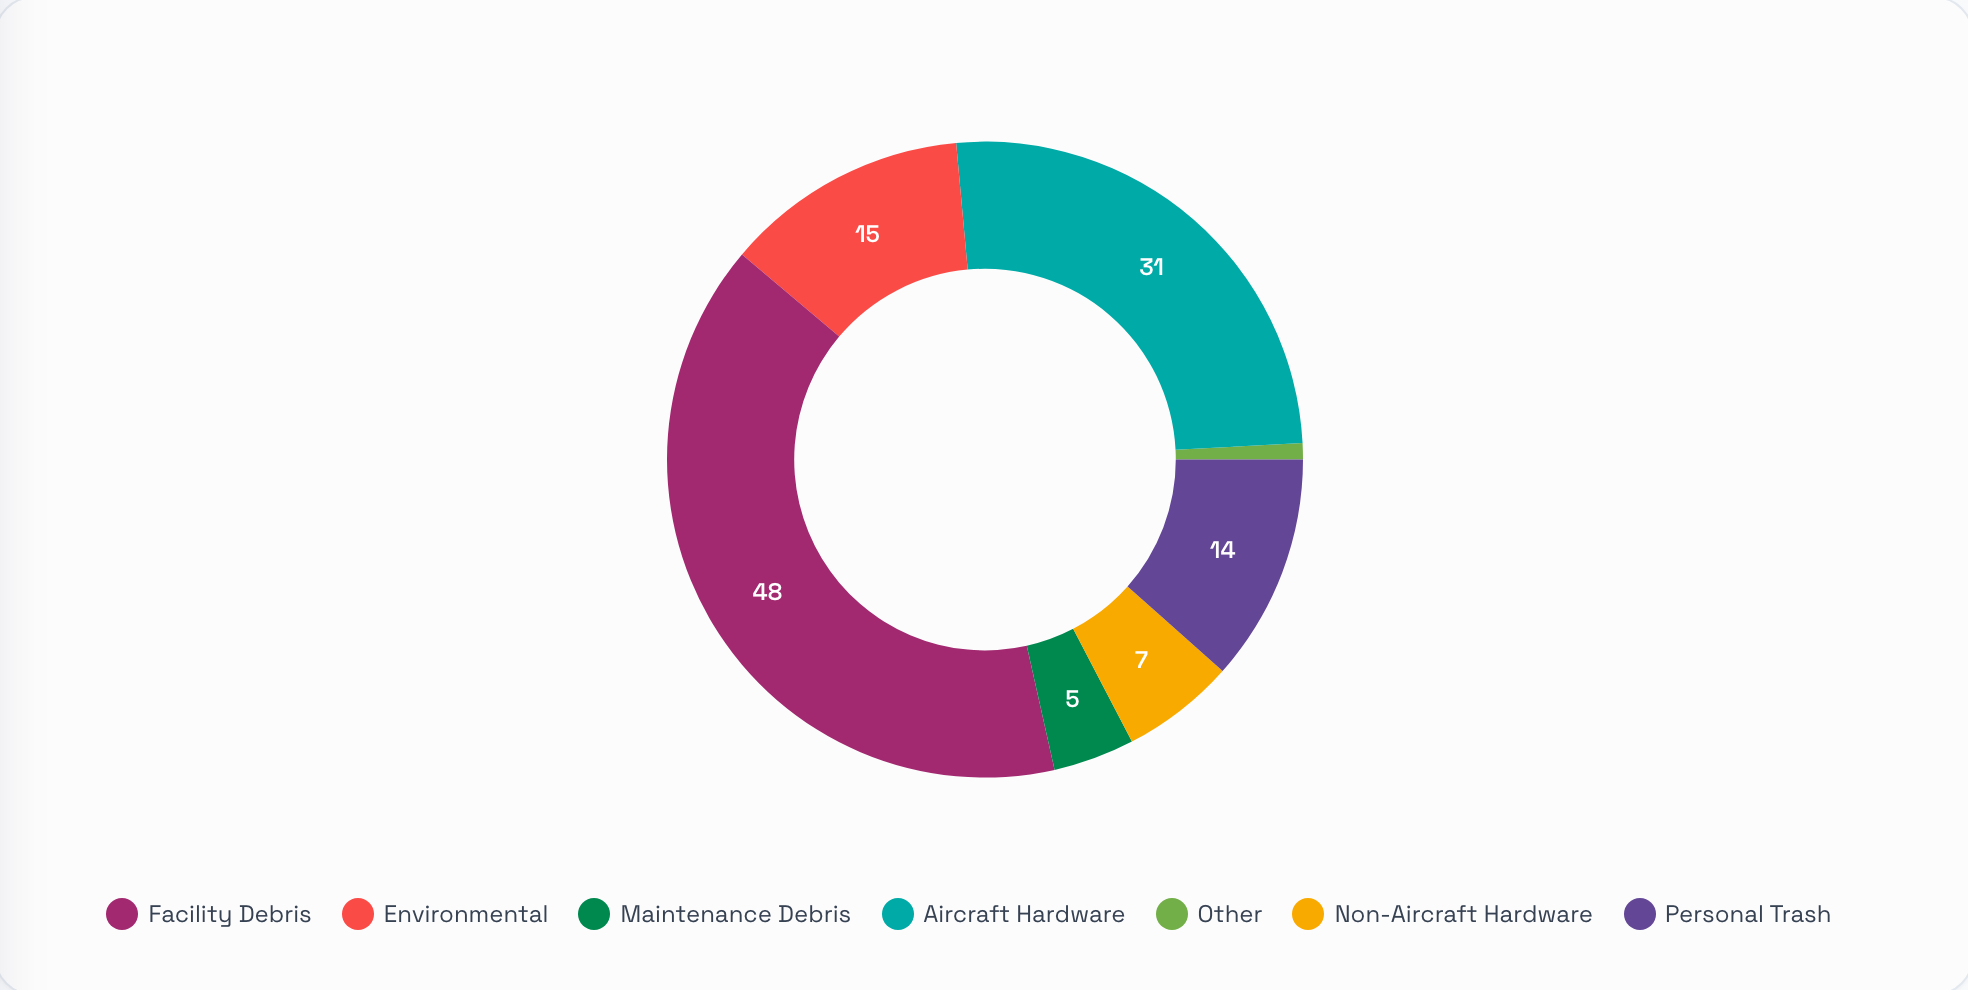
Facility Debris
48
Aircraft Hardware
31
Environmental
15
Personal Trash
14
Non-Aircraft Hardware
7
Maintenance Debris
5
Other
1
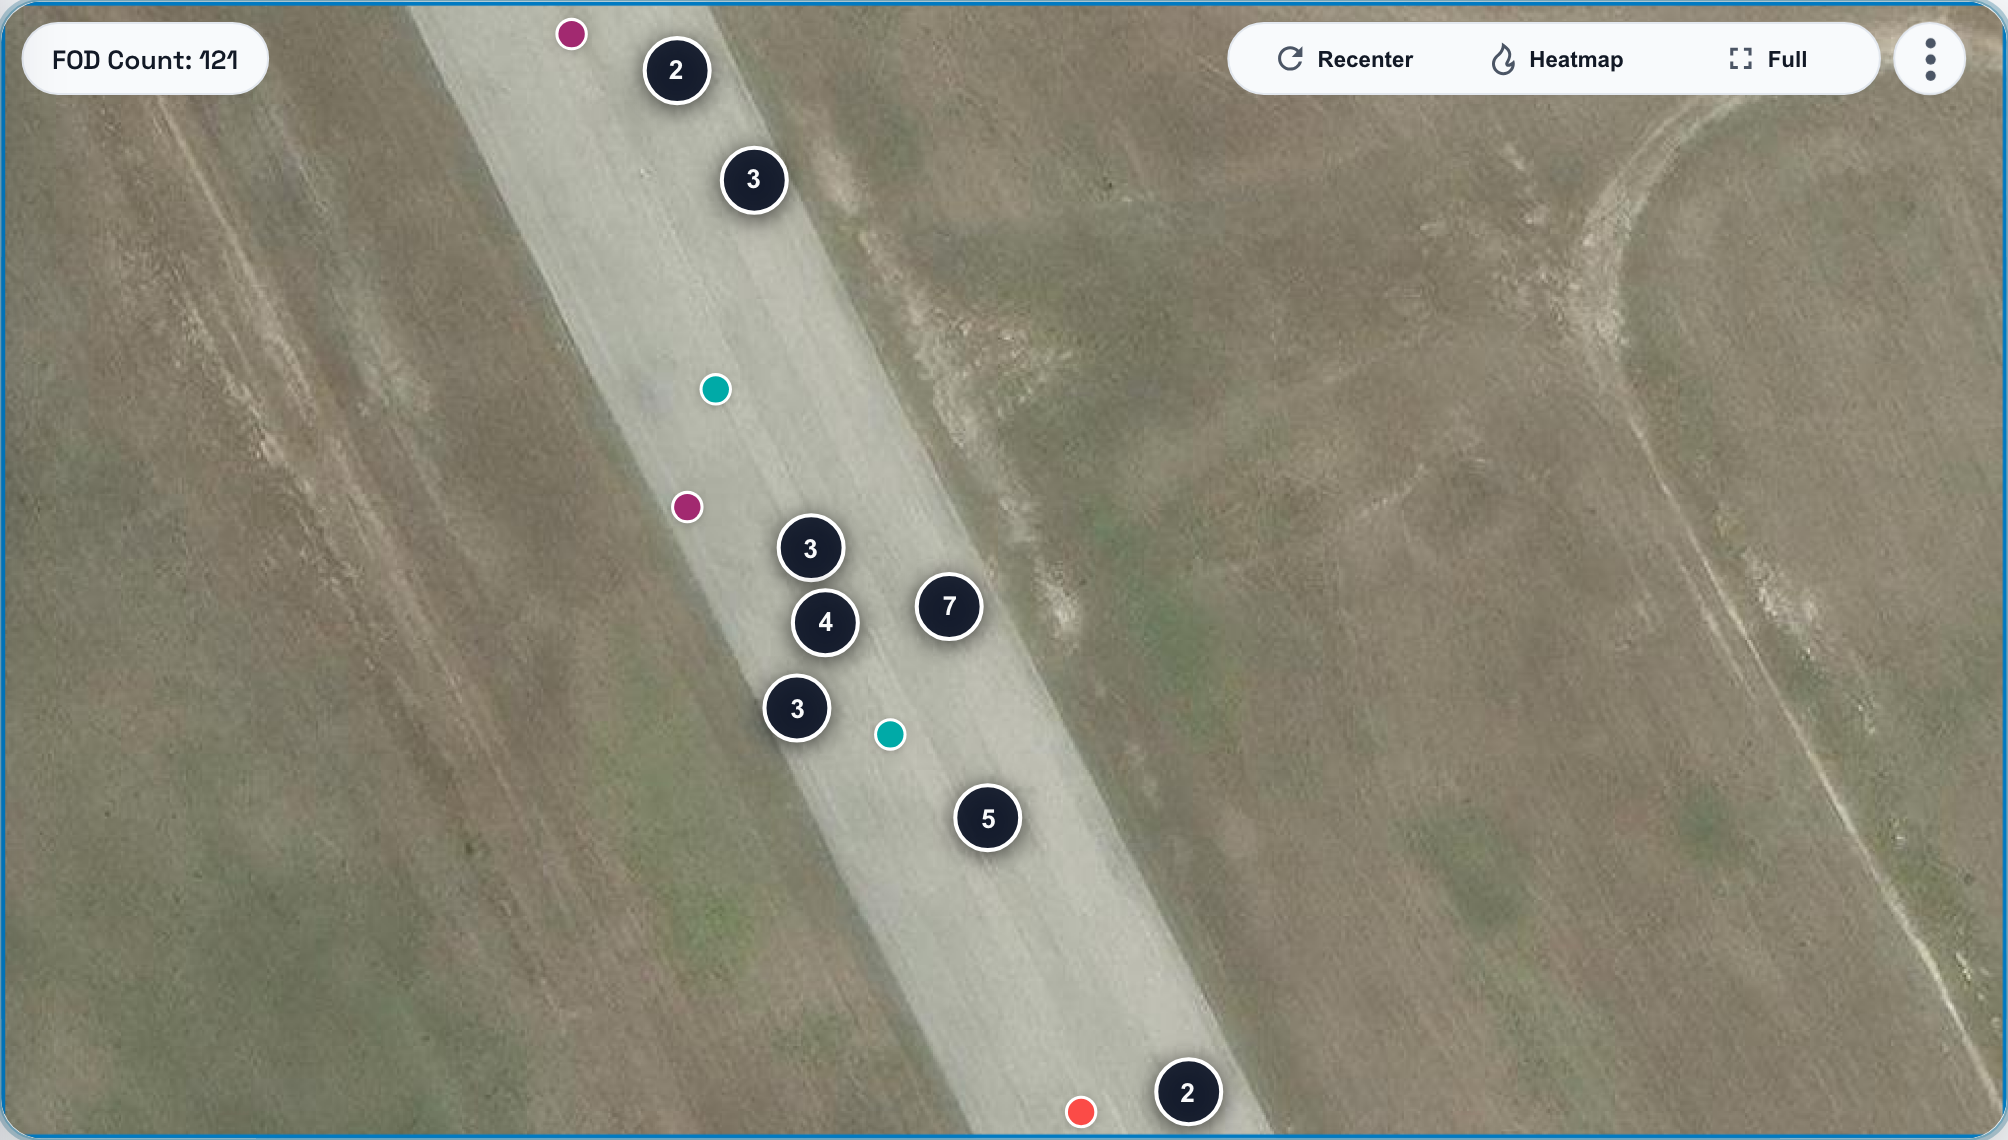
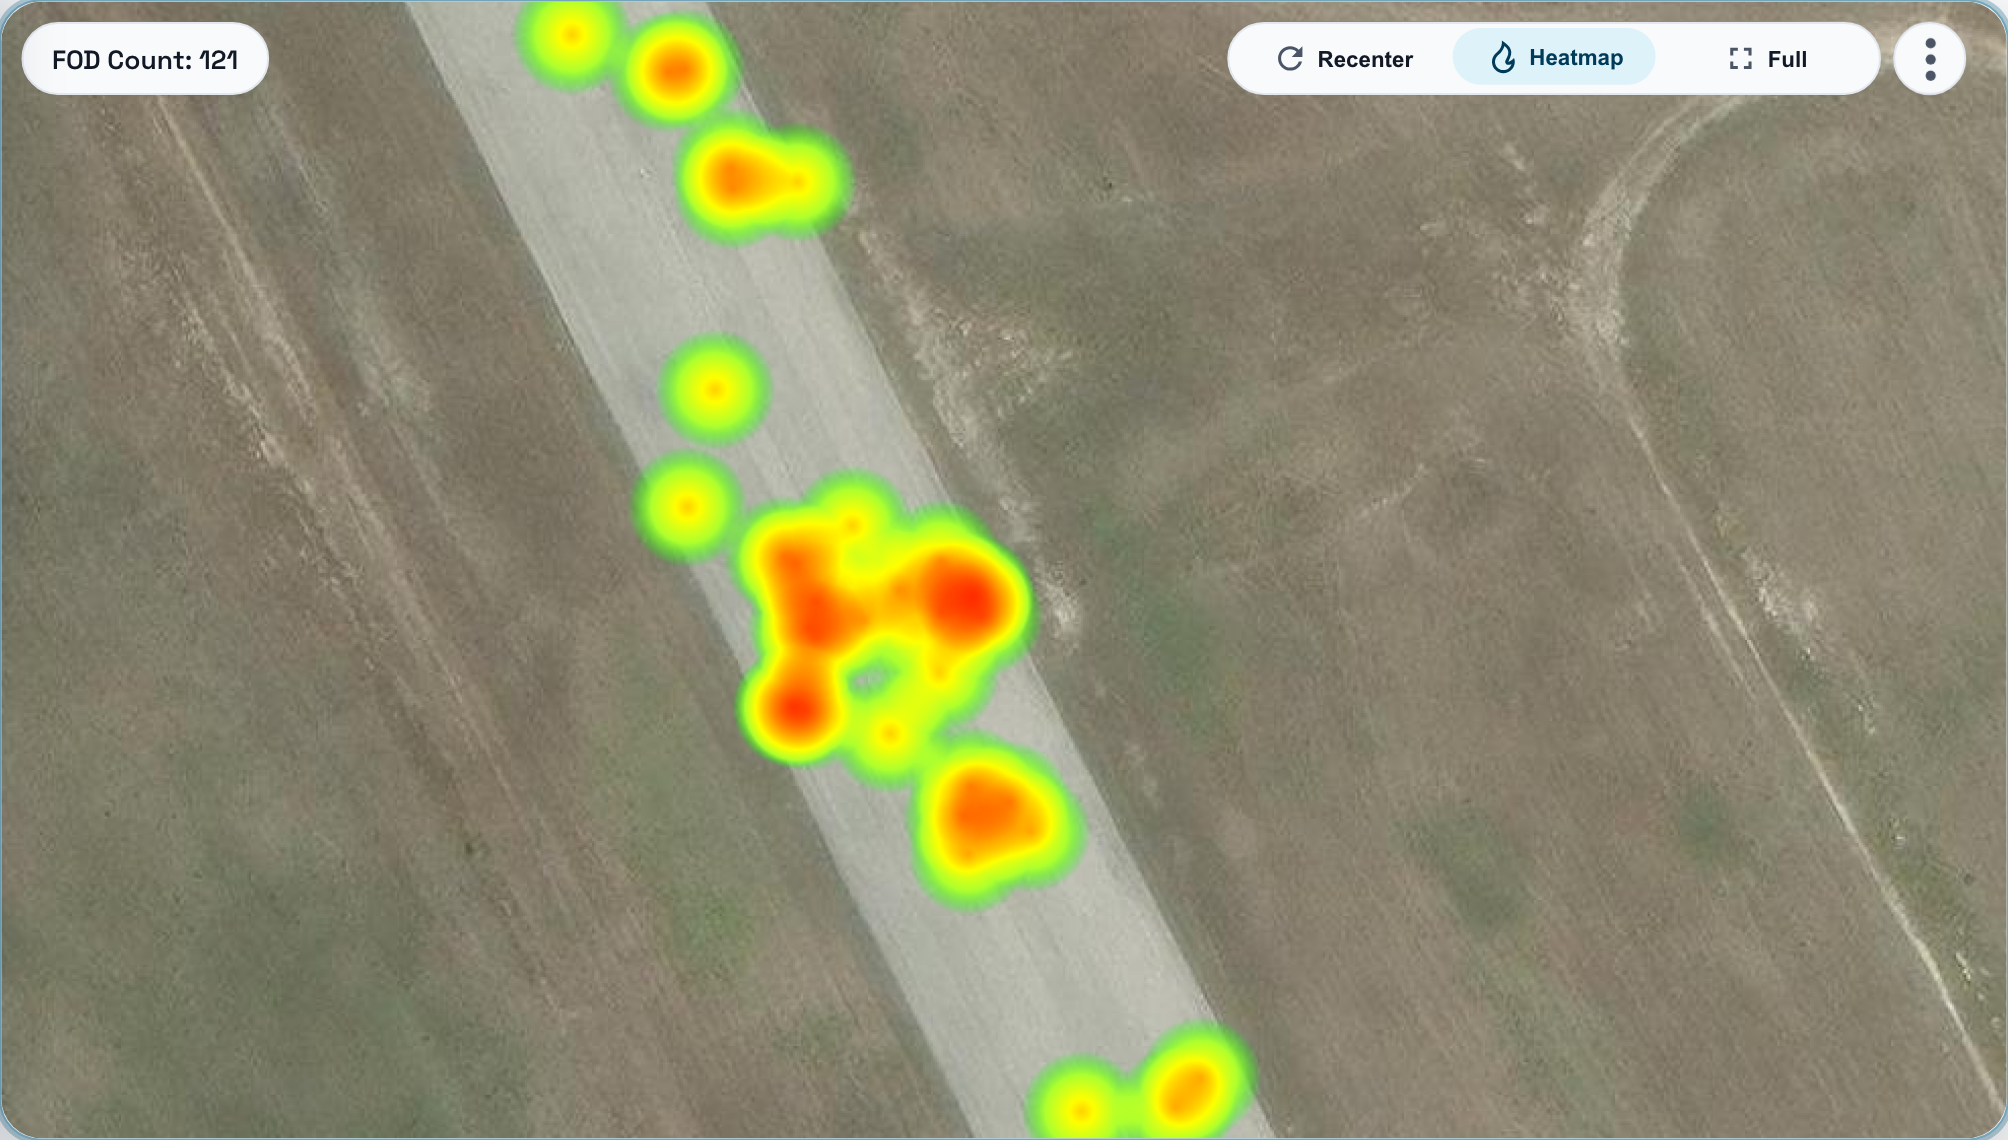
The Dashboard's map of the LPCO runway with 121 detections placed as pins, and the same detections as a heatmap.
Live product screen · Location Pins & Heatmaps

Pavement damage analytics

Track condition over time, by runway, taxiway, or apron.

FOD analytics

A running record of every detection, feeding data-driven inspection scheduling.
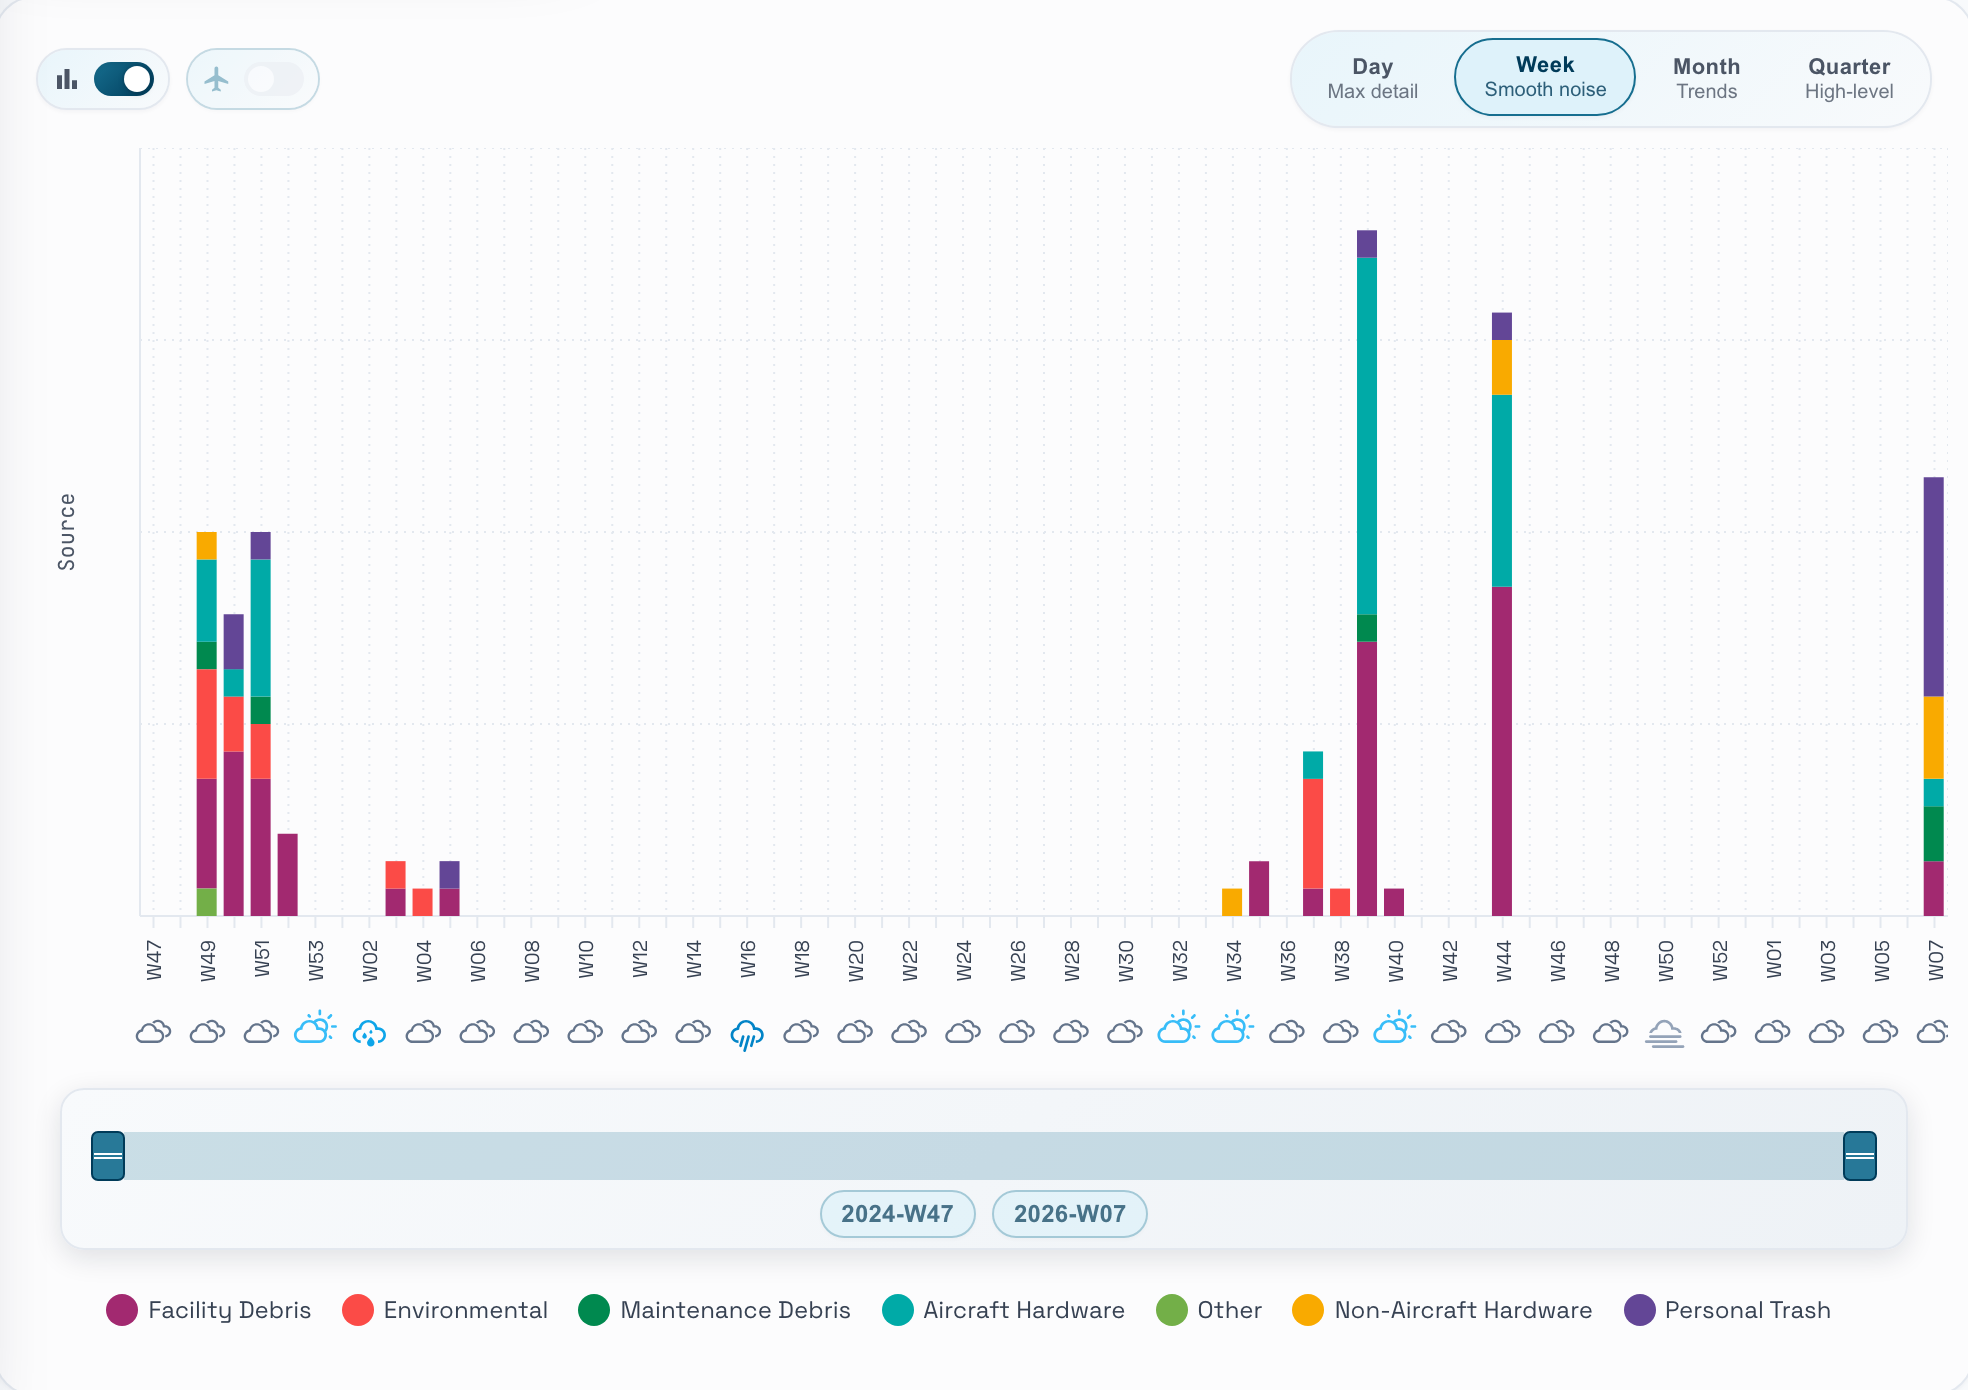
The Dashboard's Daily FOD count per source chart, stacked by source and grouped by week, 2024-W47 to 2026-W07.
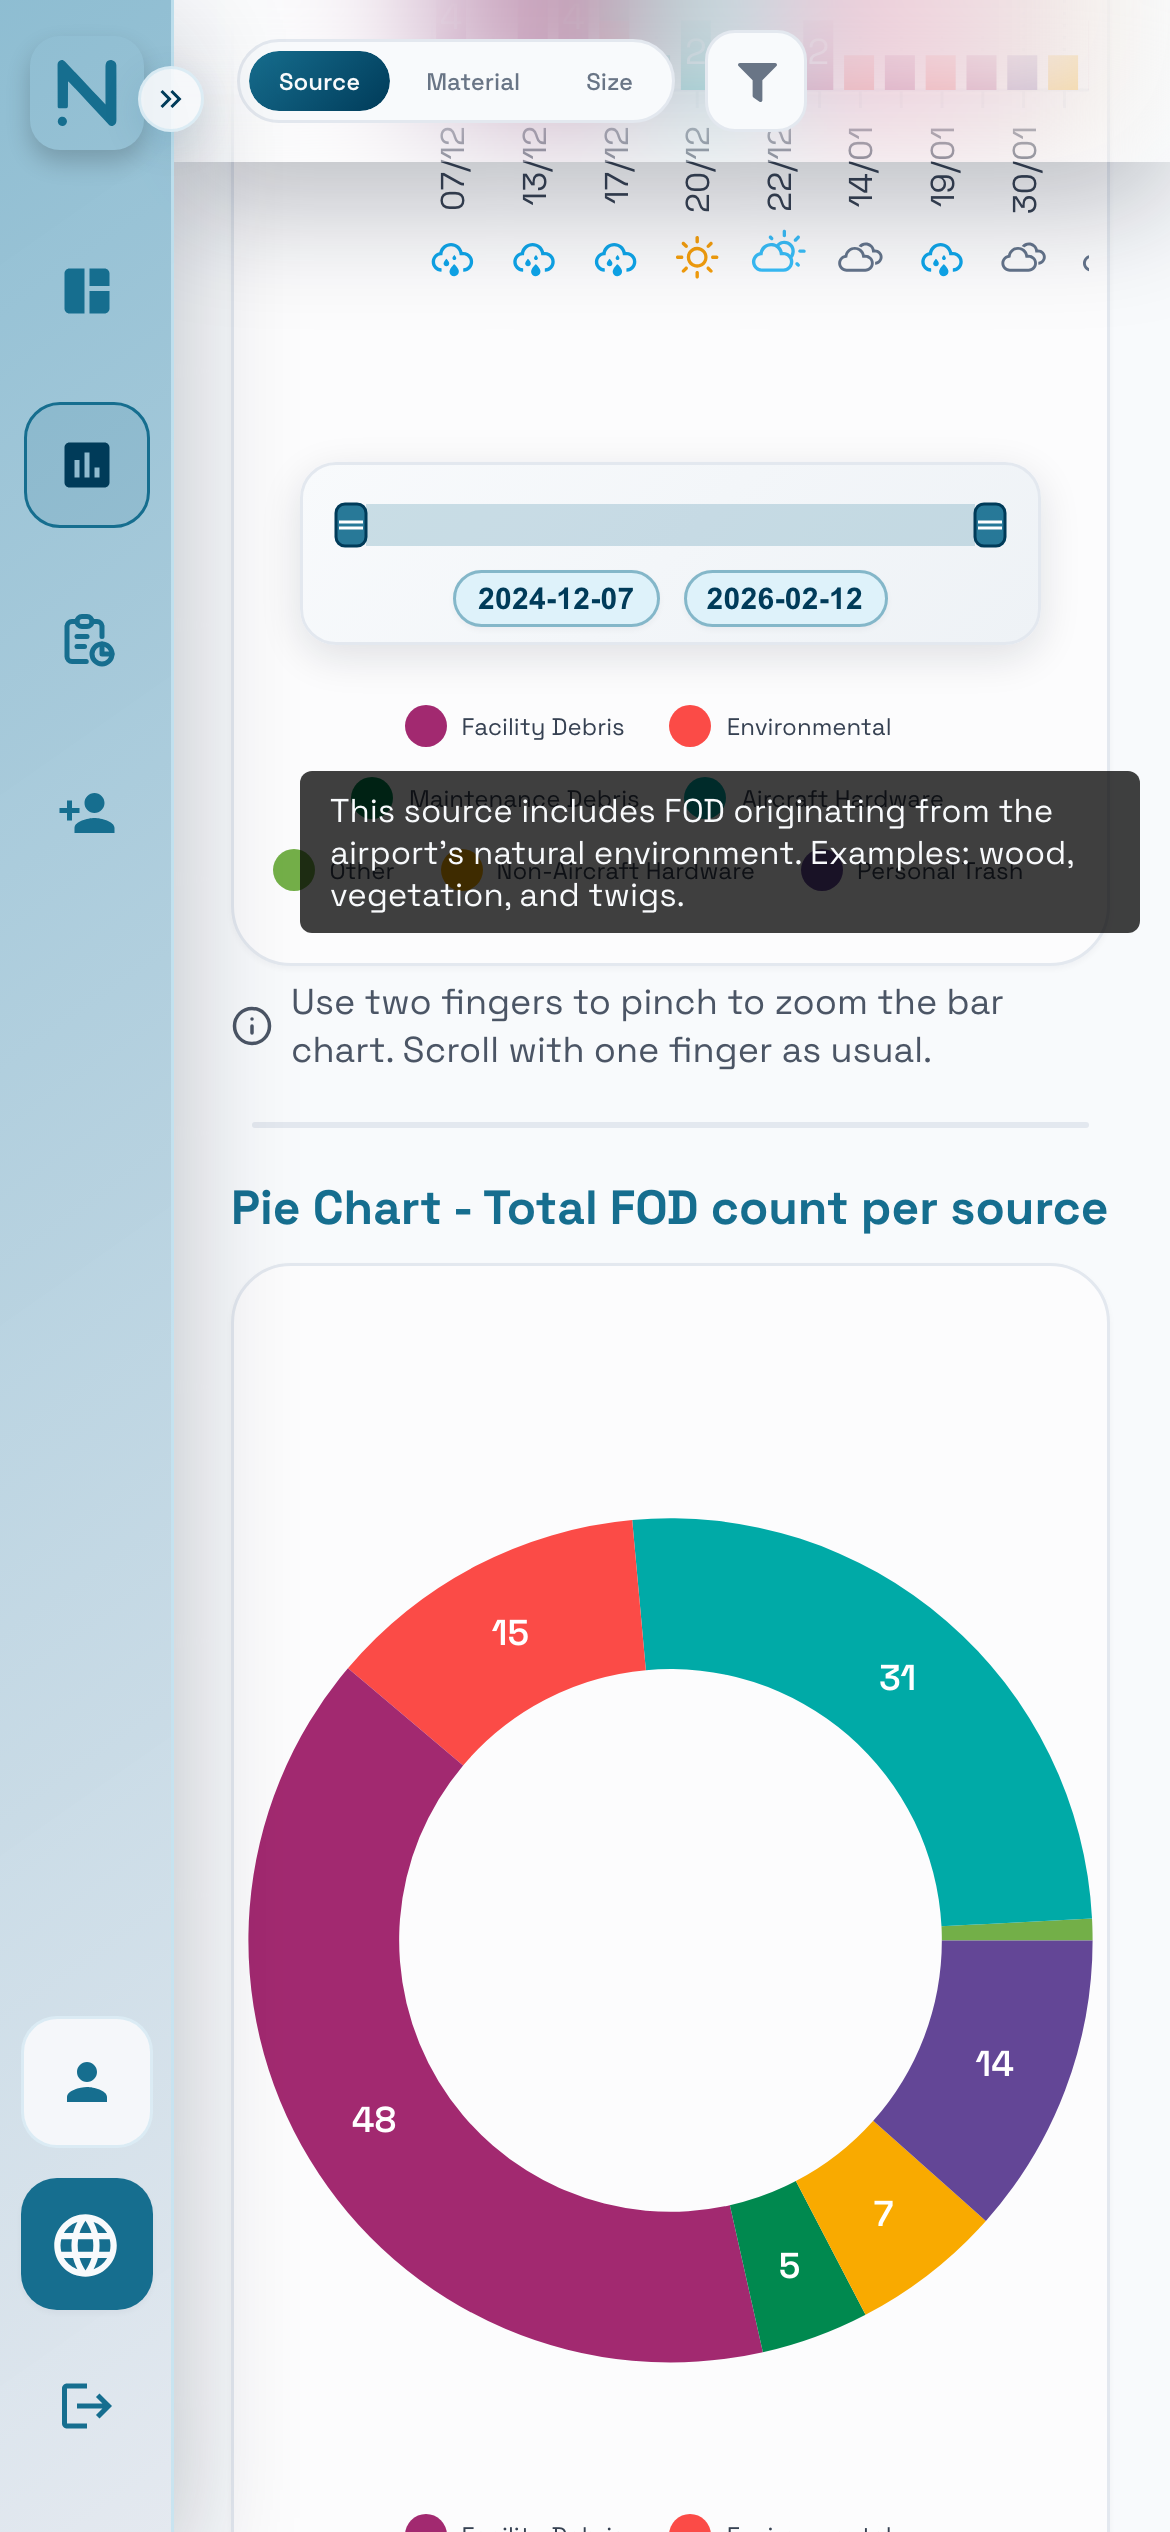
The Dashboard's own pie chart, total FOD count per source: Facility Debris 48, Aircraft Hardware 31, Environmental 15, Personal Trash 14, Non-Aircraft Hardware 7, Maintenance Debris 5, Other 1.

Live weather

Ability to integrate other sources of data relevant to FOD, such as weather

Live weather at the airport: Partly cloudy, 17.6°C, feels like 18.7°C.
  • Wind: 6.6 km/h NNW.
  • Gusts: 18.0 km/h.
  • Humidity: 88%.
  • Clouds: 75%.
  • Pressure: 1018 hPa.
  • Day/Night: Day.

7-day forecast

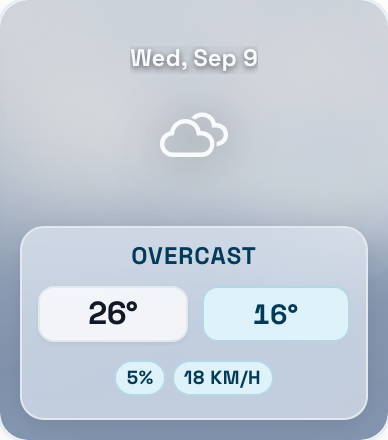
  • Wed, Sep 9: Overcast, high 26°, low 16°, 5% chance of rain, wind 18 km/h.
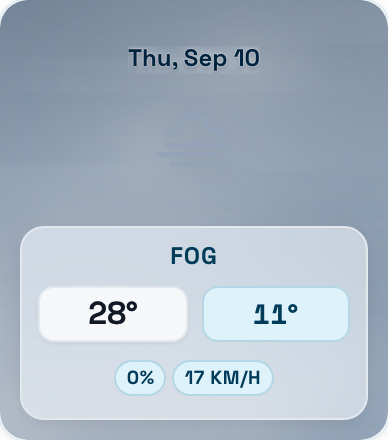
  • Thu, Sep 10: Fog, high 28°, low 11°, 0% chance of rain, wind 17 km/h.
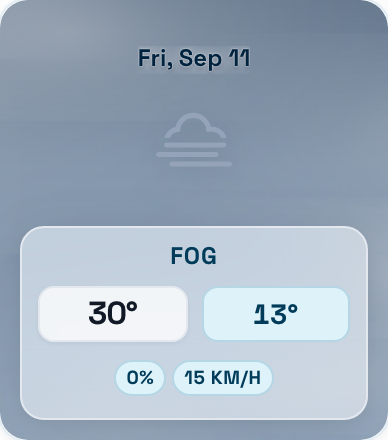
  • Fri, Sep 11: Fog, high 30°, low 13°, 0% chance of rain, wind 15 km/h.
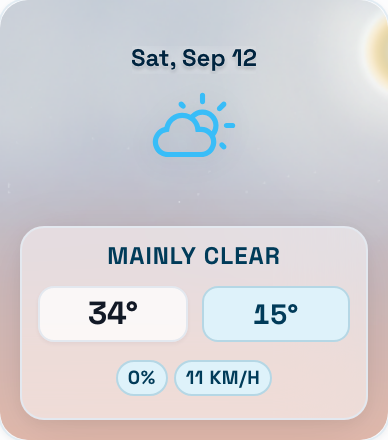
  • Sat, Sep 12: Mainly clear, high 34°, low 15°, 0% chance of rain, wind 11 km/h.
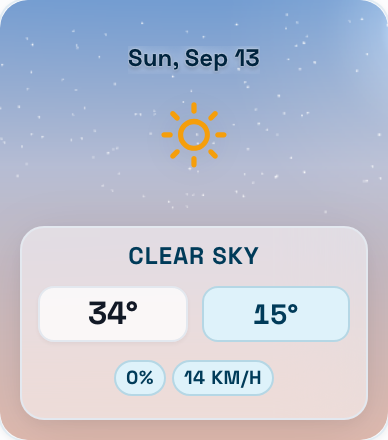
  • Sun, Sep 13: Clear sky, high 34°, low 15°, 0% chance of rain, wind 14 km/h.
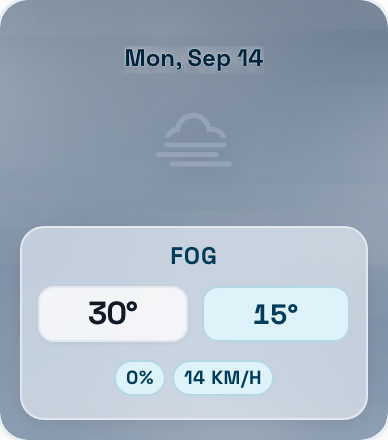
  • Mon, Sep 14: Fog, high 30°, low 15°, 0% chance of rain, wind 14 km/h.
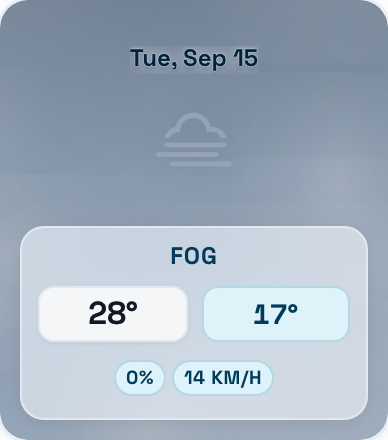
  • Tue, Sep 15: Fog, high 28°, low 17°, 0% chance of rain, wind 14 km/h.

On the go

The same data, in your pocket.

Filter by FOD type, review counts by category, and drill into any finding from a phone. No desk review required.
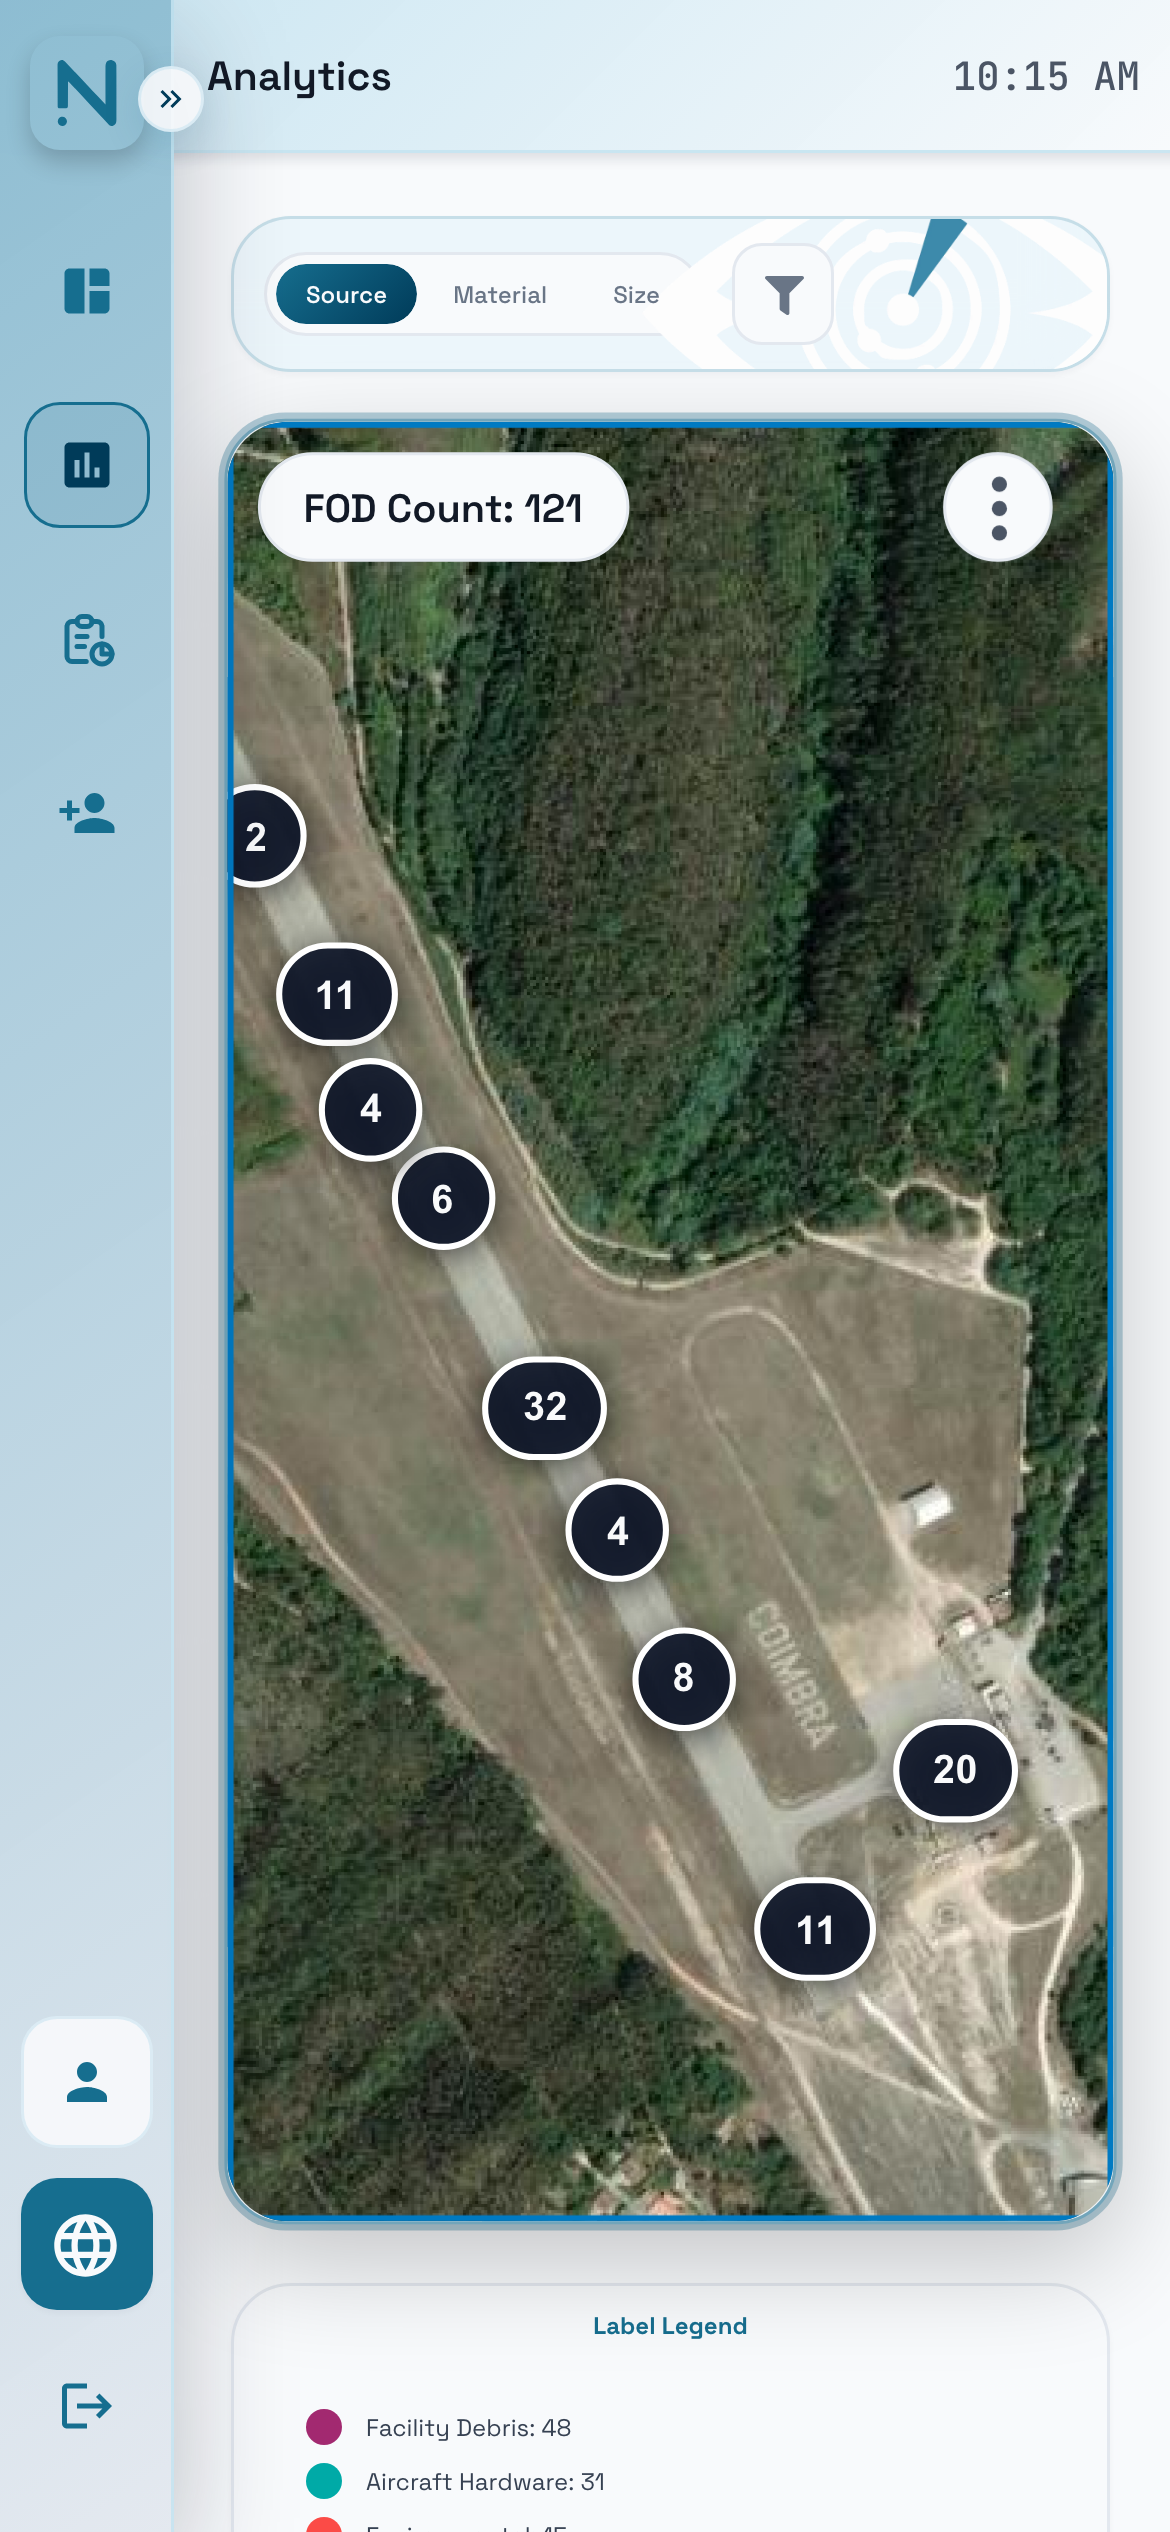
The Dashboard on a phone: the Source, Material and Size filters over the LPCO runway map, 121 detections.
The Dashboard on a phone: the total FOD count per source as a pie chart.

Visualize and analyze the data from the MDU and IDRA.

  • Mobile Detection Unit MDU

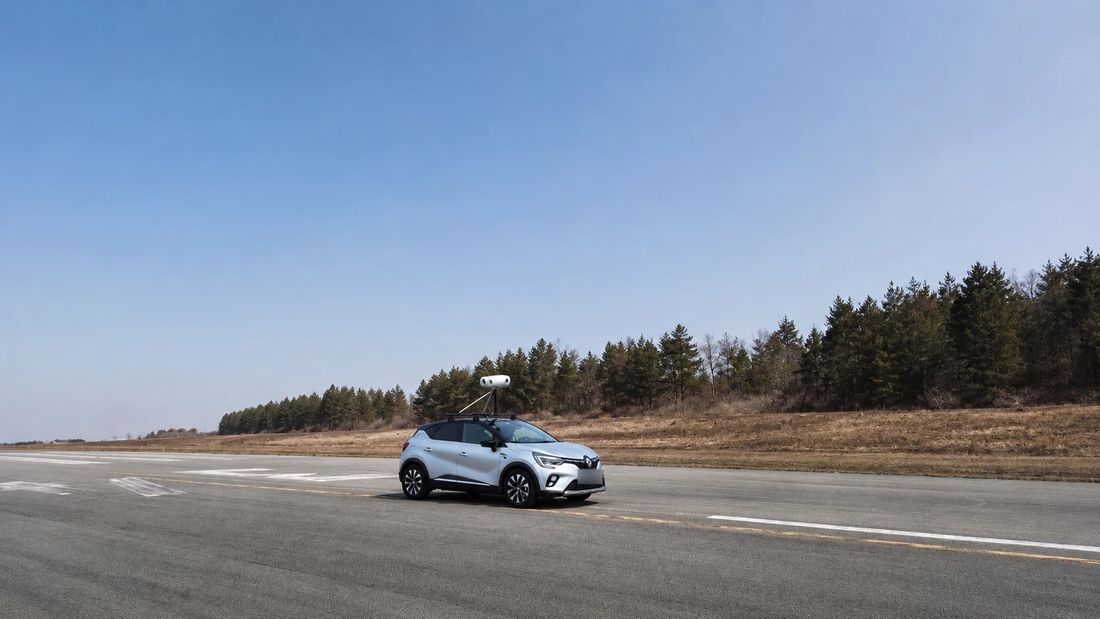
    An AI solution mounted on any mobile platform, detecting FOD, pavement damage, AGL Markings, Surface Roughness on runways, taxiways, and aprons.

    See the MDU
  • Intelligent Detection and Reporting Application IDRA

    An AI and augmented-reality app giving ground personnel an on-the-spot FOD reporting mechanism.

    See IDRA
See the Dashboard in action

→ Book a demo
  • Book a virtual demo
  • Book an on-site demo